To help you with your training plans I think it is important to consider the amount of impact your training has on triathlon race times. From gathering all available data from public sources we have compiled average finish times to help. These times are for all levels and include professional triathletes so please take that into account.
Average Triathlon Race Finish Times
Using the table below focus on the percentages, not the times. The percentages are relatively consistent across the levels while the times may vary of course. These times are an average of all entries.
Average Triathlon Times by Discipline
| Distance | Gender | Swim Time | Swim % | Bike Time | Bike % | Run Time | Run % | Total Time |
|---|---|---|---|---|---|---|---|---|
| Ironman | Men | 1:18 (78 min) | 10.3% | 6:13 (373 min) | 49.2% | 4:50 (290 min) | 38.3% | 12:38 (758 min) |
| Ironman | Women | 1:23 (83 min) | 10.2% | 6:45 (405 min) | 49.6% | 5:10 (310 min) | 38.0% | 13:35 (815 min) |
| Half Ironman | Men | 0:39 (39 min) | 11.1% | 2:54 (174 min) | 49.6% | 2:04 (124 min) | 35.4% | 5:51 (351 min) |
| Half Ironman | Women | 0:41 (41 min) | 10.8% | 3:10 (190 min) | 50.3% | 2:13 (133 min) | 35.3% | 6:18 (378 min) |
| Olympic | Men | 0:29 (29 min) | 16.8% | 1:14 (74 min) | 42.6% | 0:55 (55 min) | 31.9% | 2:53 (173 min) |
| Olympic | Women | 0:32 (32 min) | 17.1% | 1:24 (84 min) | 44.9% | 1:01 (61 min) | 32.6% | 3:07 (187 min) |
Insights for your triathlon training
1. Swim Efficiency
Across all distances and genders, the swim segment accounts for 10-17% of the total time.
Training Tip: While the swim has the smallest percentage, improving swim efficiency and reducing fatigue can help save energy for the bike and run.
2. Bike Dominance
The bike leg consistently takes up the largest portion of total time (42-50%). For both men and women, this is true across Ironman, Half Ironman, and Olympic distances.
Training Tip: Focus on sustained power output and efficient aerodynamics on the bike. Longer training rides and practicing nutrition strategies will be critical.
3. Run Importance
The run makes up approximately 32-38% of the race time. As the final leg, it’s where fatigue plays the biggest role, especially in longer distances.
Training Tip: Incorporate brick workouts (bike-to-run training) to simulate race-day fatigue and prepare the body for running off the bike.
4. Gender Differences
Women tend to have slightly higher percentages of time in the bike leg compared to men, while their swim percentages are similar. This suggests men might benefit from focusing on bike-to-run transitions, while women might consider refining bike endurance strategies.
5. Focus by Race Distance
Ironman Training: Since the bike and run make up almost 90% of the race, long-duration training sessions focusing on endurance and pacing are crucial.
Half Ironman Training: The percentages mirror Ironman, so similar strategies apply, but the shorter total time means transitions and higher-intensity training gain importance.
Olympic Training: With a higher swim percentage and shorter overall time, swimming technique and sprint endurance in all disciplines are key.
6. Race-Day Pacing
Maintaining consistent effort and pacing through each segment is vital. Over-exerting on the bike can compromise run performance.
Triathlon Race Finish Times for beginners
The table below provides times and percentages for beginners. These times have been taken from the slowest 10% of finish times to gather the output.
Beginner Triathlon Times
| Distance | Gender | Swim Time | Swim % | Bike Time | Bike % | Run Time | Run % | Total Time |
|---|---|---|---|---|---|---|---|---|
| Ironman | Men | 1:34 (94 min) | 10.3% | 7:28 (448 min) | 49.2% | 5:48 (348 min) | 38.3% | 15:10 (910 min) |
| Ironman | Women | 1:40 (100 min) | 10.2% | 8:06 (486 min) | 49.6% | 6:12 (372 min) | 38.0% | 16:18 (978 min) |
| Half Ironman | Men | 0:47 (47 min) | 11.1% | 3:29 (209 min) | 49.6% | 2:29 (149 min) | 35.4% | 7:01 (421 min) |
| Half Ironman | Women | 0:50 (50 min) | 10.8% | 3:48 (228 min) | 50.3% | 2:40 (160 min) | 35.3% | 7:48 (468 min) |
| Olympic | Men | 0:35 (35 min) | 16.8% | 1:28 (88 min) | 42.6% | 1:06 (66 min) | 31.9% | 3:27 (207 min) |
| Olympic | Women | 0:38 (38 min) | 17.1% | 1:41 (101 min) | 44.9% | 1:14 (74 min) | 32.6% | 3:47 (227 min) |
Triathlon training splits
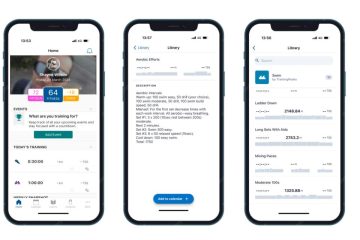
Using the data above use our triathlon training calculator to give you a guide on how to split your training between swimming, cycling and running each week. The calculator uses the results split to allow you to compete most effectively.


0 Comments